)
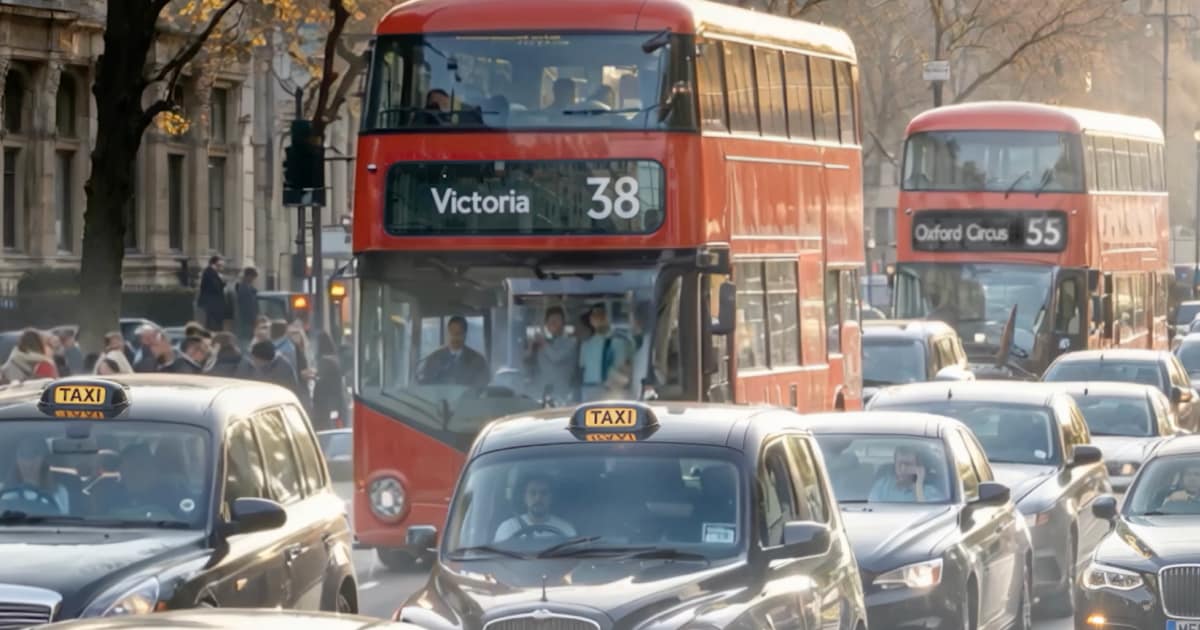
Anyone who has found themselves sitting in a London traffic jam may not be surprised to learn that the UK’s capital is its most congested – and the problem is getting worse.
The average driver in London, on an average day, spent just over 33 minutes to travel 10km in 2024. That number puts the city ahead of Dublin and Paris for the dubious title of most congested in Europe.
TomTom’s Traffic Index data shows that the average travel time in London has increased this year compared to 2023 by 40 seconds. The average speed was a crawling 18kmph (11.2mph). This works out as a delay of about eight minutes per trip when compared with how fast vehicles can move when traffic is free flowing. The overall congestion level was found to be 32%, which is almost a third.
Depressingly for Londoners, the time lost per year to traffic delays adds up to 113 hours. That could put a significant strain on productivity and efficiency for businesses, not to mention the impact on quality of life of people who live and work in the capital.
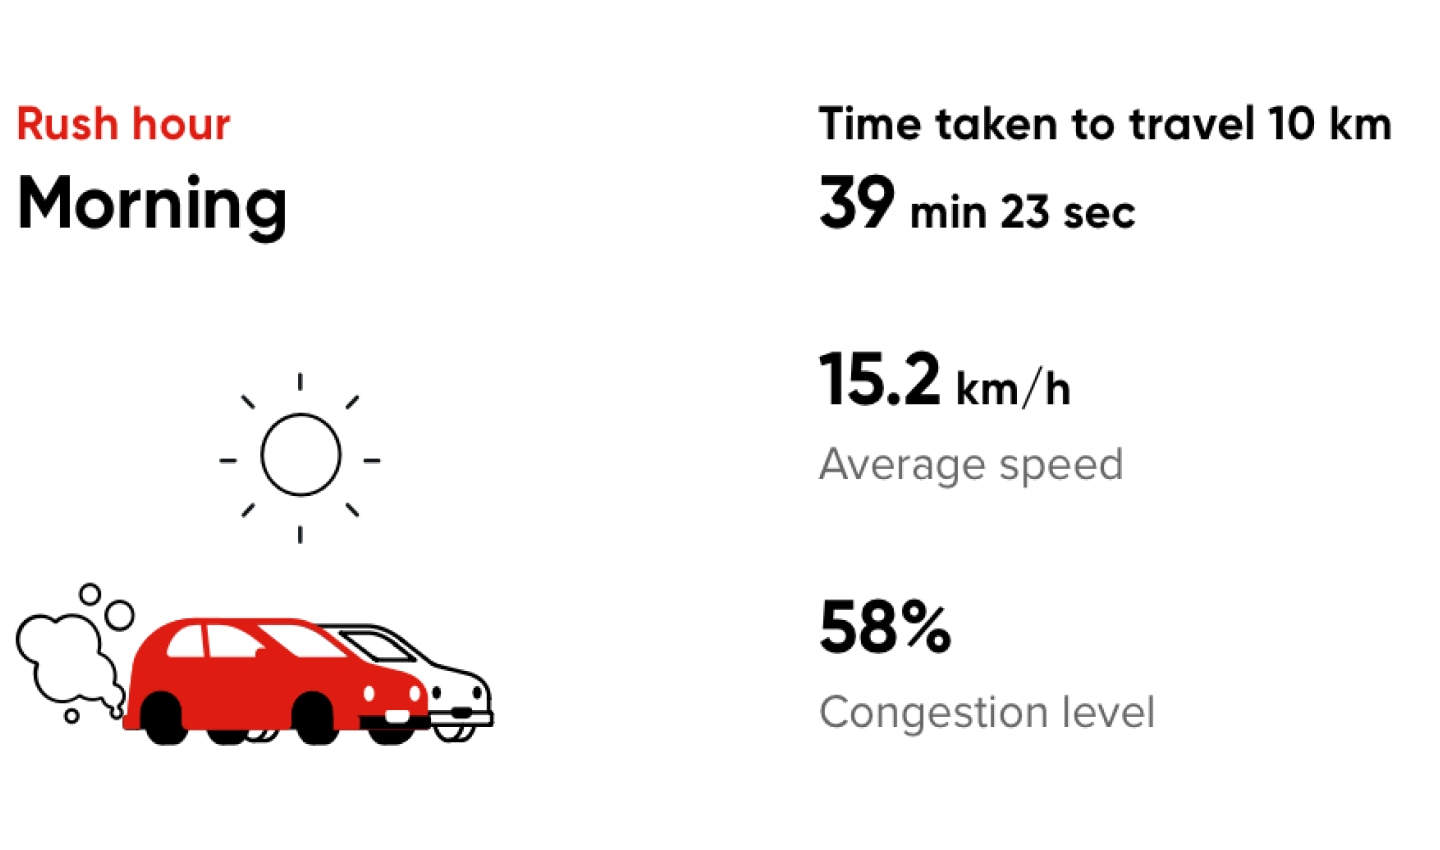
The rush hour effect
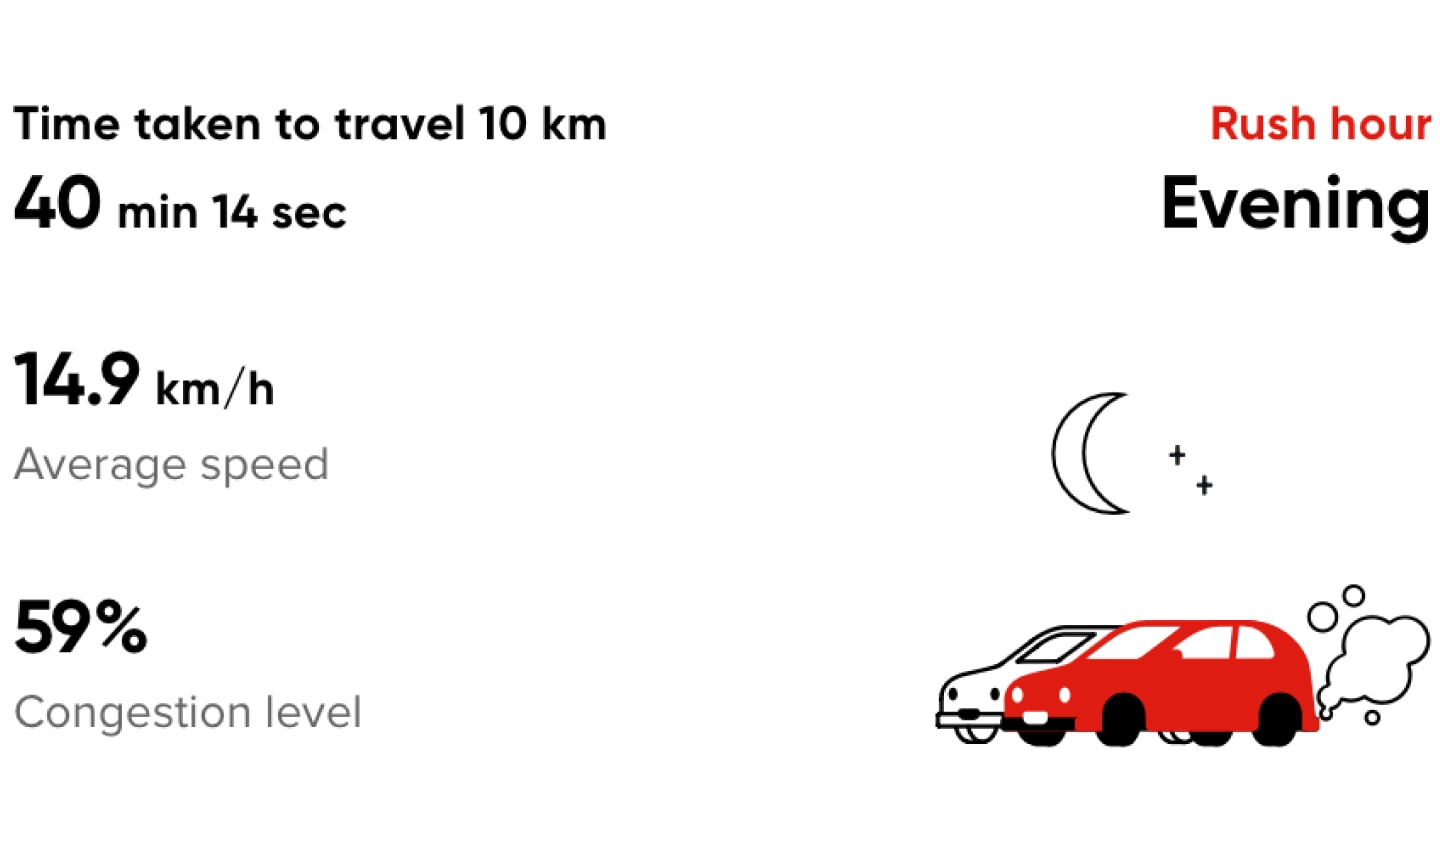
Perhaps it’s unsurprising that London’s congestion worsens during rush hour. The average 10km journey during the morning rush hour takes 39 and a half minutes. Meanwhile, in the evening, it takes 40 minutes. Londoners typically lose 46 minutes per day due to rush hour commuting.
Transport for London is aiming to get people in London to take 3m fewer trips on an average day by car by 2041. This will be achieved, the authority hopes, by a mixture of public transportation provision and encouraging other modes of transportation, such as bike, which are also healthier and more sustainable. However, for the time being, the use of cars to get to work, school or other appointments during peak times shows no sign of abating.
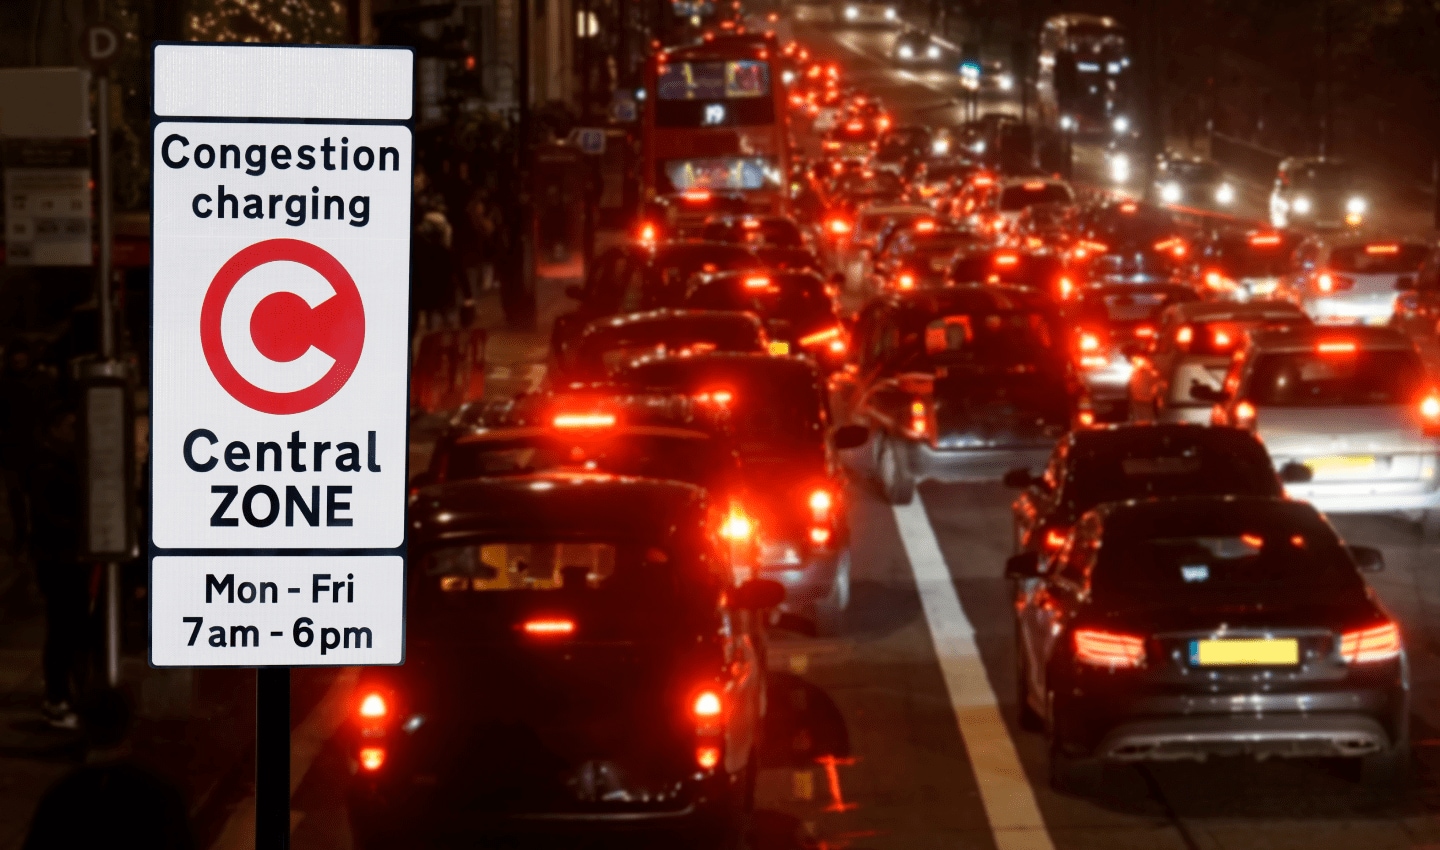
London has also had a congestion charge to enter the center of the city for just over 20 years. The area it covers has expanded in that time, and it now typically costs £15 (about $19) for any vehicle entering the zone. The idea behind the charge was to reduce the number of vehicles using the zone, especially during peak times, and to improve air quality. Air quality had fallen below recommended levels in recent decades but has recently gotten much better.
Traffic in London was further restricted by the introduction of Ultra Low Emission Zones (ULEZ), where vehicles that fail to meet certain emissions standards are subject to a daily fee. There is even a plan to pedestrianize London’s famous shopping street, Oxford Street, to give it a new lease of life. This has worked in other big cities – notably, with Times Square in New York, which is being used as a model for the scheme.
All of these initiatives, as we’ve found with traffic data, had an impact on congestion and traffic.
Why London is so congested
The population of London’s metro area is about 8.9m, with some estimates putting it even higher than that. The concentration of the UK population in this part of the country, along with the high percentage of economic and employment activity focused on the capital, are often blamed for its high congestion levels.
To make matters worse, the historic layout of many streets, which can be narrow and winding, does not make it easy for a high volume of vehicles to get around swiftly. “We’re basically 400 Roman villages, but our population’s grown in a humongous way,” London Mayor Sadiq Khan recently told The Standard. “So, we’ve got to encourage more people, if it’s possible, to use public transport.”
In 2024, some construction work including on the M25 ring road that surrounds the city, could have contributed to slower journey times. Interestingly, the TomTom Traffic Index data shows that traffic times were faster outside the city center of London. Average journey times in the metro area were 19 minutes and 57 seconds for 10 km, with only 68 hours lost per year because of traffic delays. This suggests life in the suburbs is less congested than in the center, in contrast to cities where the congestion spreads to the outer areas. Nevertheless, those times are still far from ideal.
According to Transport for London (TfL), 70% of London’s congestion is caused by “demand exceeding capacity.” The challenge for London is reducing the number of cars on the roads while making sure that people have other ways of getting around the city. Almost 10 million car journeys are made in London every day, TfL estimates, and more than 30% of these could be walked in 25 minutes while about 1.7m could be made easily by bus. Key to encouraging people to opt for these alternatives will be making streets more attractive places to walk, cycle or catch a bus. TfL also has plans to improve bus journey times, which inevitably will require a reduction in overall congestion.
Another issue is the volume of deliveries in London. Although the pandemic introduced a culture of working from home that has persisted to some extent, in hybrid models, it also led to an increase in home deliveries that appears to be here to stay. These short journeys have no doubt added to congestion.
Low traffic neighborhoods (LTNs), introduced before the pandemic and then increased in number during lockdown, have made some neighborhoods safer and stopped these vehicles from driving there but are not without controversy. The LTNs have attracted protests as well as support.
The TomTom Traffic Index’s travel times, congestion levels and speeds are based on trip data anonymously collected from drivers within the urban area throughout the complete road network — including fast roads and highways crossing this area. They reveal a complex picture of a city that is constantly tackling its traffic problem – but for those trying to get around in London, the changes are perhaps not happening quickly enough.
Want to see how your city ranked in this year's Traffic Index?
People also read
)
London is still the world's slowest city — highlights from the latest TomTom Traffic Index
)
Do low emission zones work? TomTom Traffic Index has the answer
)
How mapmakers keep chaotic traffic under control during a total solar eclipse
)
Induced demand: The traffic paradox that we all need to know about
* Required field. By submitting your contact details to TomTom, you agree that we can contact you about marketing offers, newsletters, or to invite you to webinars and events. We could further personalize the content that you receive via cookies. You can unsubscribe at any time by the link included in our emails. Review our privacy policy. You can also browse our newsletter archive here.